Statistical Data Notes – Class 10 AI (417) | Practical Revision

Get comprehensive practical revision notes of statistical data class 10 AI and data science essentials designed to help you ace your board exams and practicals. This Unit 4 Statistical Data is assessed in practical examinations as per the CBSE syllabus.
What is Data Science?
Data Science is a field that combines statistics, data analysis, and machine learning to understand real-world problems, analyse data patterns, and make accurate predictions and decisions.
It uses knowledge from:
- Mathematics
- Statistics
- Computer Science
- Information Science
Applications of Data Science
1️⃣ Internet Search: Search engines like Google use data science algorithms to provide best results in fractions of a second.
2️⃣ Targeted Advertising: It is a major application of data science, where audiences are identified using data science algorithms based on their behaviour, preferences, and data patterns for personalized advertising.
3️⃣ Website Recommendations: Key application of data science, where systems suggest relevant products or content based on a user’s past searches, behaviour, and interests to improve user experience.
Example: Product suggestions on Amazon.
Benefits:
- Better user experience
- Personalized suggestions
- Increased sales
4️⃣ Genetics & Genomics: Data Science enables personalized treatment by combining medical and genomic data for disease research, drug response analysis, and genetic risk prediction.
- Benefits:
- Personalized treatment
- Better understanding of DNA
- Individual healthcare improvement
- Advance generic risk prediction
Introduction to No-Code, Low-Code, and High-Code
There are three most popular approaches to code:
- High-Code
- Low-Code
- No-Code
📌 No-Code
- Completely code-free platforms for beginners.
- Use graphical interfaces to build AI solutions.
- No prior technical knowledge required.
📌 Low-Code
- Uses templates and drag-and-drop with minimal coding.
- Allows some customization with basic coding.
- Suitable for users with basic technical knowledge.
📌 High-Code
- Requires writing full code from scratch.
- Needs advanced programming skills.
- Offers full control over application design and features.
| Aspect | High Code | Low Code | No Code |
| Definition | Traditional development using full coding | Uses tools with some coding | No coding required |
| Coding Required | All code is written manually | Some coding required | No coding needed |
| Users | Professional developers | Users with basic technical knowledge | Anyone (beginners) |
| Cost | Expensive | Less expensive than high code | Least expensive |
| Customization | Full control and customization | Limited customization | Very limited customization |
| Ease of Use | Difficult | Moderate | Very easy (drag-and-drop) |
Why do we need No-Code AI?
- Reduces coding errors, making development easier.
- No coding required → no syntax or programming issues.
- Cost-effective compared to fully coded AI systems.
- Companies can build AI solutions without hiring experts.
- Easy to use – even students can create AI models.
- Uses drag-and-drop interface for simple development.
- Allows users to see what they are building in real time.
Who can use No-Code AI?
- Accessible to the general public.
- Suitable for non-technical users like doctors, architects, and musicians.
Benefits of No-Code Tool
- Accessibility: Both technical and non-technical can solve business problems
- Easy to Use: Drag and drop features makes it very easy to create applications
- Fast: Development is significantly faster than traditional development
- Innovation: Business user can build solutions for unique problems
Disadvantages of No-Code tools
- Lack of Flexibility: Drag-and-drop features are convenient, but they limit customization and flexibility in no-code platforms.
- Automation Bias: Users may rely too much on the tool’s decisions and ignore other correct information or human judgment.
- Security Issues: These platforms may not focus strongly on security and offer limited control, making them less suitable for handling sensitive data.
Popular No-Code AI Tools
| No-Code tool | Details | Released |
| Azure Machine Learning | Cloud-based ML service by Microsoft Allows building ML models without coding Supports data cleaning, training, evaluation, and deployment | July 2014 |
| Google Cloud AutoML | Cloud-based service provided by GoogleEnables users with limited ML knowledge to build high-quality models Allows creation of custom ML models quickly Models can be easily used in applications and websites | January 2018 |
| Orange Data Mining | An open-source data visualization, machine learning and data mining toolkit. Developer: University of LjubljanaNo coding required Easy to use with attractive visuals | October 1996 |
| Lobe AI | Create custom machine learning models using a visual interfaceMakes machine learning simple and easy Free and easy-to-use for training models Automatically trains and exports custom models | 2015 |
| Teachable Machine | Web-based tool for creating ML models easily Supports training with images, sounds, and poses No coding or technical expertise required | November 2017 |
Important Concepts in Statistics
Statistical Sampling
- The entire set of raw data available for test is called population
- Sample or portion of the population is taken for test.
Descriptive statistics
- Helps in understanding the basic characteristics of data
- Mean: Average value of the data
- Median: Middle value in sorted data
- Mode: Most frequently occurring value
Distribution
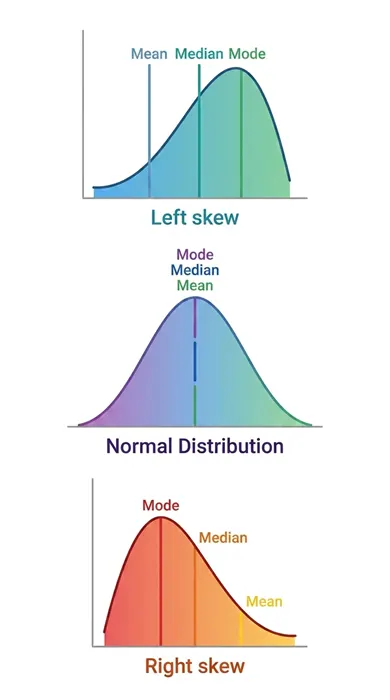
Probability
- Probability is the likelihood (chance) of an event occurring.
- An event is the outcome of an experiment.
- Events can be:
- Independent (not affected by other events)
- Dependent (affected by other events)
Variance
- Variance: Shows how far data values are from the mean (spread of data).
- Standard Deviation: Indicates how widely values are distributed.
- Outlier: A data value that is very different from other values
Orange Data Mining
- An open-source data visualization, machine learning and data mining toolkit.
- Developer: University of Ljubljana
- No coding required
- Data analysis is done through Python and visual programming.
- perform operations on data through simple drag and drop steps.
- Easy to use with attractive visuals
Orange Data Mining Widgets
🔹 Data Exploration Widgets
- Used to explore and understand data patterns or trends
- Scatter Plot: Shows relationship between two variables
- Data Table: Displays and inspects data
- Distributions: Shows data distribution (histograms)
🔹 Preprocessing Widgets
- Used to clean up data and ensure data is on same scale
- Impute: Handles missing values
- Normalize: Scales data to a common range
- Select Columns: Choose specific columns from datasets
🔹 Feature Selection Widgets
- Used to select important features of data for analysis
- Select Columns: Chooses relevant features
- Select Best Features: Automatically selects important features
🔹 Modelling Widgets
- Used to build machine learning models like decision trees or clustering algorithms
- Classification Tree: Constructs a decision tree classifier.
- k-Means: Performs k-means clustering on the data.
- Support Vector Machine: Trains a support vector machine classifier.
- Logistic Regression: Constructs a logistic regression model.
🔹 Evaluation Widgets
- Used to check model performance
- Test & Score: Evaluates model accuracy
- Cross Validation: Tests model reliability
- ROC Curve: Shows model performance graph
🔹 Visualization Widgets
- Used to represent data visually like charts or graphs
- Bar Chart: Displays data in bars
- Heat Map: Shows data intensity using colors
- Scatter Plot: Shows relationship between variables
Note: Unit 4 (Statistical Data) is assessed in practical examinations as per the CBSE syllabus.