Class 12 AI (843) – Data Science Methodology Notes
Trying to ace Class 12 AI Data Science Methodology with high score?
Well, here it is! This Data Science Methodology Notes of Class 12 AI provides simplified explanations of all key concepts for clear understanding and effective exam preparation. Whether you’re preparing for your board exams or working on your AI project, these notes are all you need to master the Data Science methodology.
Data Science Methodology – Introduction
Data Science Methodology is a structured process that involves a series of iterative steps followed by data scientists to analyse a problem and develop an effective solution.
- Data Science Methodology gives data scientists a framework for designing an AI project.
- It helps the team decide on the methods, processes, and strategies required to achieve the desired output.
- It also helps in organizing the project efficiently and completing it in a systematic way, saving time and cost.
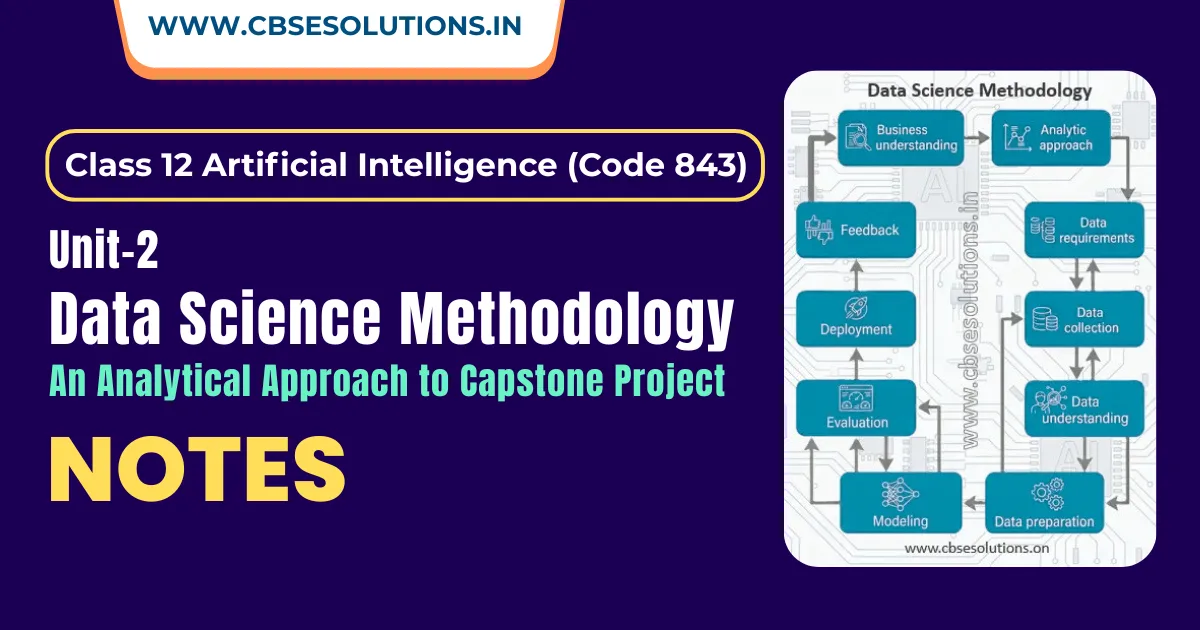
Stages of Data Science Methodology
Data Science Methodology consists of 5 stages, and each stage includes 2 steps, as shown below:
- From Problem to Approach
- Business Understanding
- Analytic Approach
- From Requirements to Collection
- Data Requirement
- Data Collection
- From Understanding to Preparation
- Data Understanding
- Data Preparation
- From Modelling to Evaluation
- AI Modelling
- Evaluation
- From Deployment to Feedback
- Deployment
- Feedback
IMG
From Problem to Approach
Business Understanding
- Business Understanding is also known as Problem Scoping and Defining
- Identify and understand customer requirements, define clear objectives, and prepare a list of business needs to achieve customer goals
- The team can use the 5W1H Problem Canvas and the Design Thinking (DT) framework to gain a deeper understanding of the issue.
- Apply Design Thinking (DT) framework to approach the problem
Analytic Approach
- Once the business problem is clearly defined, the data scientist can decide the analytical approach.
- This stage involves seeking clarification from stakeholders so that the AI project team can decide the correct approach to solve the problem.
- To solve a particular problem, there are four main types of data analytics:
- Descriptive Analytics
- Diagnostic Analytics
- Predictive Analytics
- Prescriptive Analytics
- Descriptive Analytics:
- Explains what has happened by analysing past data using graphs, charts, and statistical measures (mean, median, mode).
- Example: calculate average marks of students in exam
- Diagnostic Analytics:
- Explains why it happened by finding causes using techniques like root cause and correlation analysis.
- Example: Identify why some students scored low (e.g., lack of practice or weak concepts).
- Predictive Analytics:
- Predicts what is likely to happen next using past data and methods like regression and classification.
- Example: Predict which students are likely to score low or high in the next exam
- Prescriptive Analytics:
- Suggests what actions should be taken to achieve the best outcome based on data insights.
- Suggest actions like extra classes or revision plans to improve student performance.
Summary of each Analytics
IMG
From Requirement to Collection
Data Requirement
- This stage involves defining data requirements, including type, format, source, and preprocessing to ensure the data is accurate and usable.
- The 5W1H questioning method can be employed in this stage also to determine the data requirements.
Note: Data for a project can be categorized into three types: structured data (organized in tables, e.g., customer databases), unstructured data (without a predefined structure, e.g., social media posts, images), and semi-structured data (having some organization, e.g., emails, XML files).
Data Collection
- Data collection is the process of gathering observations or measurements
- Review and update data requirements (decide if more or less data is needed)
- Sources of Data Collection:
- Primary Data:
- Collected firsthand (surveys, interviews, observations, experiments)
- Raw, original, and reliable
- Examples: feedback forms, marketing campaigns, sensor data
- Secondary Data:
- Already available data (books, websites, databases)
- Collected through methods like web scraping, social media tracking
- Sources: government portals, organizations, online platforms
From Understanding to Preparation
Data Understanding
- Verify whether the collected data is relevant, complete, and suitable for solving the given problem.
- Analyse the data using descriptive statistics and visualization techniques (like correlation and histograms) to understand its quality and gain initial insights
Data Preparation
- This stage involves all activities required to build the dataset for the modelling step. The data is transformed into a clean and structured form, making it easier to analyse.
- It includes:
- Cleaning data (handling missing or invalid values, removing duplicates, and formatting properly)
- Combining data from multiple sources (tables, archives, platforms)
- Transforming data into meaningful input variables
Feature Engineering
- Feature engineering is the process of selecting, modifying, or creating new features (variables) from raw data so that a machine learning model can make better and more accurate predictions.
- In simple words, it means converting raw data into meaningful information that helps the model understand patterns easily.
- Example: Online Shopping (Customer Purchase Prediction)
- Problem: Predict whether a customer will buy a product
- Raw Data: Age, number of website visits, time spent on website
- New Features (using feature engineering):
- Average time per visit = Total time spent / number of visits
- Engagement level = High / Medium / Low (based on time spent)
- Visit frequency = Visits per week
From Modelling to Evaluation
AI Modelling
- In this stage, prepared dataset is used to build models based on the chosen analytical approach
- The modelling process is usually iterative, requiring adjustments in data preparation
- Multiple algorithms are tested to find the most suitable model
- Models can be descriptive or predictive depending on the problem
Descriptive Modeling:
- Focuses on understanding and summarizing data without making predictions
- The goal of descriptive modeling is to describe the data rather than make decisions based on it.
- Common Descriptive Techniques
- Summary statistics (mean, median, mode, variance, range)
- Visualizations (bar charts, histograms, pie charts, scatter plots)
Predictive Modeling:
- Focuses on predicting future outcomes using past data and statistical algorithms
- Uses techniques like regression, classification, and forecasting for predictions
- Relies on a training dataset that helps evaluate and improve (calibrate) the model
- The data scientist tests different algorithms to ensure only relevant variables are selected for the model.
Evaluation
- Process of Assessing how well the model performs after training
- Uses test data and metrics like accuracy, precision, recall, and F1 score
- It Ensures the model is reliable and effective before real-world use
Phases of Evaluation:
Model evaluation can have two main phases:
- Diagnostic Measures (First Phase):
- Check if the model is working as expected
- For predictive models, tools (like decision trees) are used to evaluate output and alignment with the design
- For descriptive models, test data with known outcomes are used to assess performance
- In both cases, identify if the model needs adjustments or improvements and refine it based on evaluation results
- Statistical Significance Test (Second Phase):
- Verify that the model accurately processes and interprets the data.
- Ensures results are reliable and not random.
From Deployment to Feedback
Deployment
- Deployment refers to the stage where the trained AI model is made available to the users in real-world applications.
- The model may be tested with a limited group or in a test environment before full deployment
Feedback
- The last stage of Data Science Methodology.
- It includes collecting results, gathering feedback, and monitoring performance after deployment until the model meets the desired outcomes.
- Feedback from the users will help to refine the model and assess it for performance and impact.
- Data scientists may automate feedback to accelerate model refinement and obtain faster, improved results

Model Validation
- Model validation is performed after model training to evaluate how well the model works using a testing dataset.
- It ensures that the model makes accurate and reliable predictions during development.
Benefits of Model Validation:
- Improves the quality of the model
- Reduces the risk of errors
- Prevents model from overfitting and underfitting
Model Validation Techniques
- The commonly used Validation techniques are:
- Train-test split
- K-Fold Cross Validation
- Leave One out Cross Validation
- Time Series Cross Validation
Train-Test Split
- A technique used to evaluate machine learning algorithms
- Applicable to classification and regression problems
- Help check how well the model performs on new/unseen data
- Ensure the model can be used in real-world situations
- It involves dataset that is divided into two parts:
- Training Dataset: Used to train (fit) the model
- Test Dataset: Used to evaluate the model’s performance
How to configure Train-Test Split:
- The procedure has one main configuration parameter, i.e., the size of the training and test datasets
- These sizes are usually expressed as percentages (between 0 and 1)
- The split percentage is not fixed and varies based on project requirements
Factors to Consider while choosing split percentage:
- Computational cost of training the model
- Computational cost of evaluating the model
- Proper representation of the training dataset
- Proper representation of the test dataset
Common Split percentage:
- Train: 80%, Test: 20%
- Train: 70%, Test: 30%
- Train: 67%, Test: 33%
K-Fold Cross Validation:
- A technique used to evaluate model performance where dataset is divided into k (multiple) equal parts (folds)
- Trains the model on some folds and tests it on others, repeating the process multiple times as defined by the data scientist
- In cross-validation, the model is tested on different subsets of data to get multiple measures of model performance
Working of K-Fold Cross Validation
- Divide the dataset into k equal parts (folds)
- Select one-fold as the validation (test)
- Use the remaining k-1 folds as training data
- Train the model and evaluate its performance
- Repeat the process k times, using a different fold as the validation set each time
- Calculate the average performance from all iterations
- Each fold acts as a validation (test) set once
- Ensures that all data is used for both training and testing
- Provides multiple performance results
Advantages:
- Gives a more accurate and reliable evaluation of the model
- Reduces bias due to a single train-test split
Limitation:
- Time-consuming, as the model is trained multiple times
Difference between Train-Test Split and Cross Validation
| Train-Test Split | Cross Validation |
| Normally applied on large datasets | Normally applied on small datasets |
| Divides data into training set and testing set | Divides data into multiple subsets (folds) |
| Model is trained on training data and tested once on test data | Model is trained and tested multiple times on different folds |
| Has a clear separation between training and testing data | No fixed separation; each data point can be used for both training and testing |
| Faster and less time-consuming | More accurate but time-consuming |
Evaluation Metrics
- Evaluation metrics are used to measure the performance of a trained model on test data
- They help identify the model’s strengths and weaknesses
- Enable comparison of different models to choose the best one
- Different metrics are used for classification and regression problems
Evaluation Metrics for Classification
Confusion Matrix:
- A table used to evaluate the performance of a classification model
- Compares predicted values with actual outcomes
- Forms an N × N matrix (N = number of classes to be predicted)
- For binary classification, it creates 2 × 2 matrix (Yes/No)
- Components:
- True Positive (TP): Predicted Yes and actually Yes
- True Negative (TN): Predicted No and actually No
- False Positive (FP): Predicted Yes but actually No
- False Negative (FN): Predicted No but actually Yes
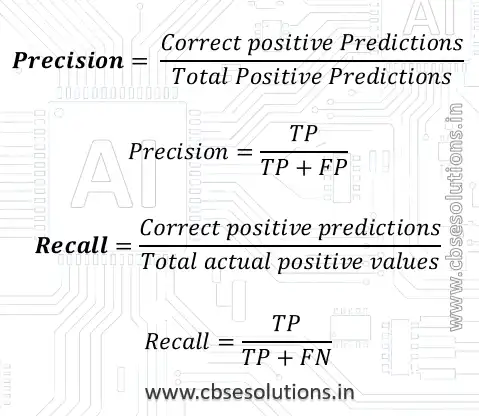
Precision and Recall
- Precision is the ratio of correctly predicted positive cases to the total predicted positive cases.
- Recall is the measure of our model correctly identifying True Positives.
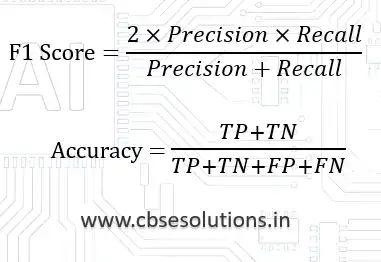
F1 Score
- A good F1 score means the model makes fewer mistakes, correctly identifies real cases, and gives very few false alarms (predictions).
- An F1 score is considered perfect when it is 1, while the model is a total failure when it is 0.
Accuracy
- Accuracy = Number of correct predictions / Total number of predictions
Evaluation Metrics for Regression
MAE (Mean Absolute Error):
- Mean Absolute Error is a sum of the absolute differences between predictions and actual values.
- A value of 0 indicates no error or perfect predictions
MSE (Mean Squared Error):
- MSE is the mean(average) of squared distances between our target variable and predicted values.
- Most commonly used metric to evaluate the performance of a regression model.
RMSE (Root Mean Squared Error):
- Root Mean Square Error (RMSE) is the standard deviation of the residuals (prediction errors).
- RMSE is often preferred over MSE because it is easier to interpret since it is in the same units as the target variable.