AI with Orange Data Mining Tool Notes – Class 12 AI | Practical Exam Preparation
Prepare smarter for your CBSE Class 12 board practical exam with AI with Orange Data Mining Tool Notes, covering all key concepts & latest syllabus-aligned.
What is Data Mining?
Data mining is the process of discovering trends, useful information, and patterns from large datasets to support decision-making.
Orange Data Mining Tool – Introduction
- Orange Data Mining Tool: Orange is an open-source, component-based visual programming software used for data visualization, machine learning, data mining, and data analysis.
- Widgets: Widgets are graphical components in Orange that perform specific tasks, such as loading data, visualizing information, preprocessing data, building models, and evaluating their performance.
How to download and install Orange tool?
- Visit the website https://orangedatamining.com/download/
- Choose correct version –
- For window users – download ‘Standalone installer’
- For Mac users – Select ‘Orange for Apple silicon’
- After downloading the Installer Install the software. To do so double click on installer file and follow on-screen instructions to install Orange on your system.
Beneficiaries of Orange data mining
Data Analyst and Scientist – Orange provides a user-friendly interface for data analysis to the professionals who may not have extensive programming skills.
Researchers – Orange provides easy-to-use tools to explore and analyse research data, test ideas, and gain useful information from experimental results.
Educators and Students – Orange’s user-friendly interface and visual programming environment make it easier to understand complex concepts through visual representations and practical examples.
Business Professionals – Orange’s data visualization and predictive modeling tools help businesses identify trends, predict customer behaviour, improve processes, and make better decisions conveniently.
Open-Source Community – Orange is an open-source software tool that is freely available for everyone to use.
Components of Orange Data Mining Tool
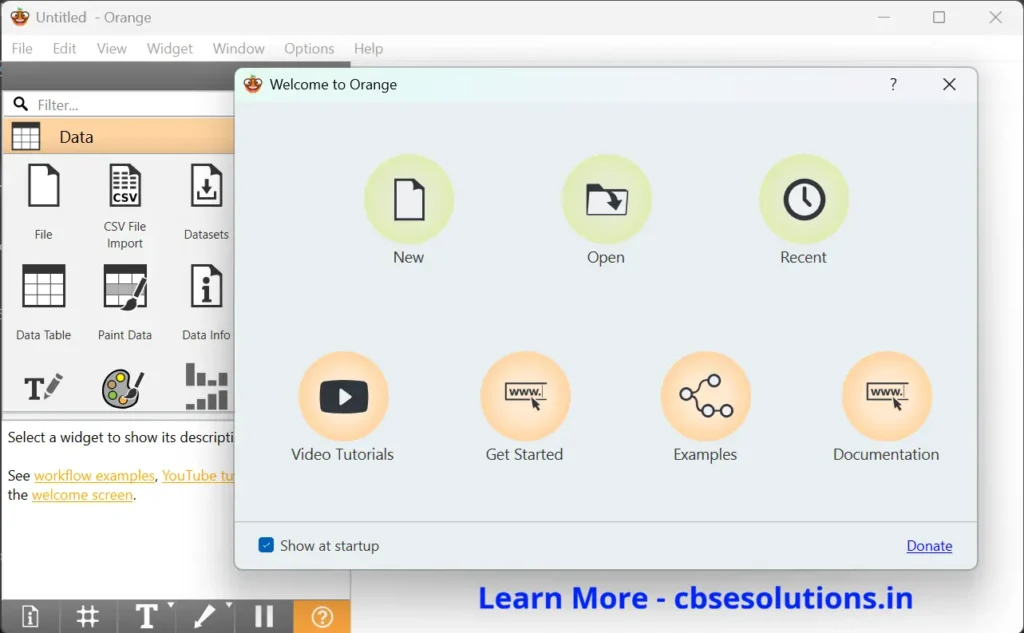
- Blank Canvas: The blank canvas is the workspace where users drag, drop, arrange, and connect widgets to build a data analysis workflow from input to output.
- Widgets: Widgets are graphical elements that perform specific operations on data, such as reading, transforming, visualizing, and analyzing data.
- Connectors: Connectors are lines that link widgets on the canvas and show how data flows from the output of one widget to the input of another.
Default Widget Catalog
Data Widgets
Data widgets are used to load, read, and display datasets. The File widget reads data files, the Data Table widget displays data in a spreadsheet-like format, and the SQL Table widget reads data from an SQL database.
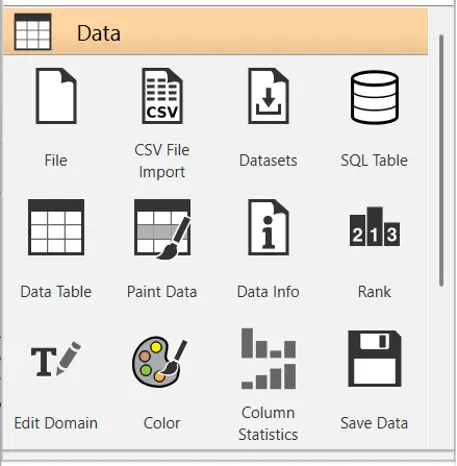
Transform widget
Transform widgets are used to modify or transform datasets during the analysis process
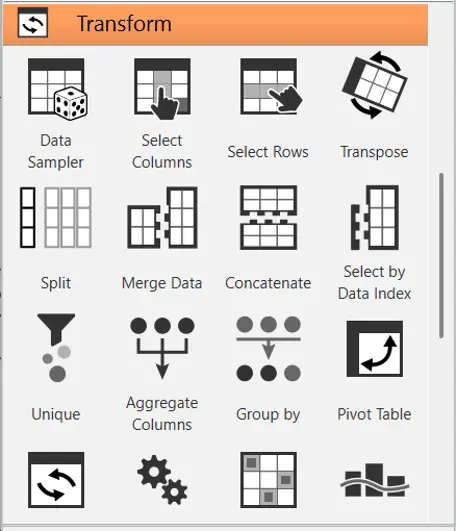
Visualize Widgets
Visualization widgets display data graphically using charts such as scatter plots, bar charts, and heatmaps.
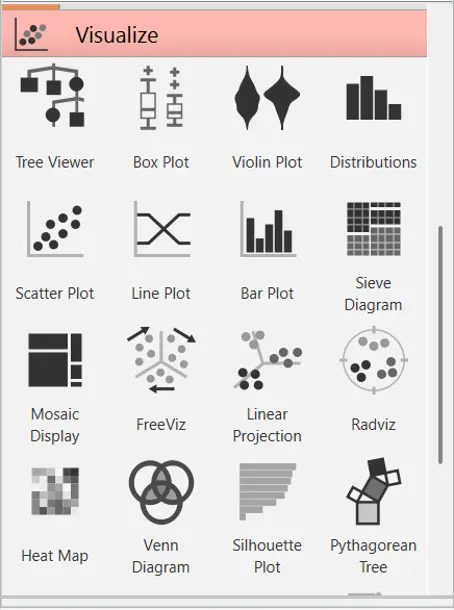
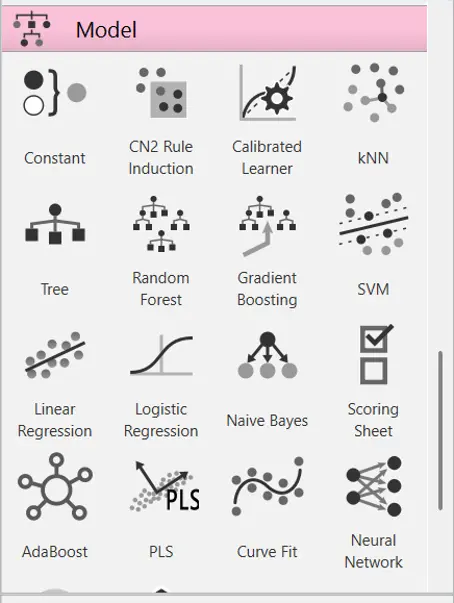
Model Widgets
Model widgets apply machine learning algorithms, such as classification, regression, clustering, and anomaly detection, to build predictive models and identify data patterns.
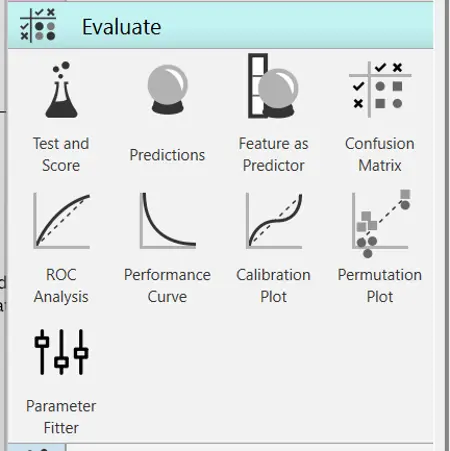
Evaluate Widgets
Evaluate widgets assess model performance using techniques such as cross-validation and confusion matrices.
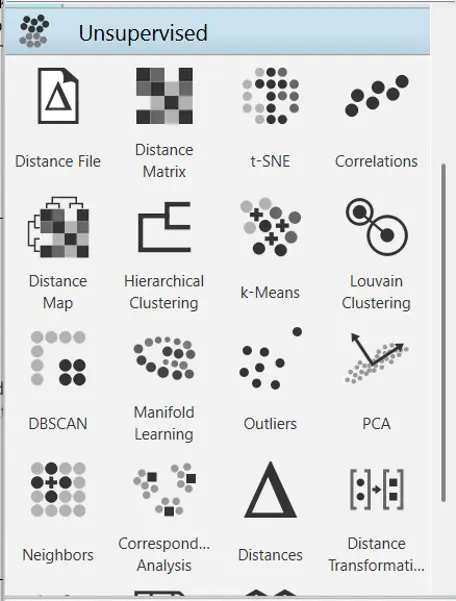
Unsupervised Widgets
Unsupervised widgets help discover patterns in data without labelled outputs. They support tasks such as clustering, dimensionality reduction, and association rule mining
Key Domains of AI with Orange Data Mining Tool
- Data Science: Data Science involves exploring and analyzing data to discover useful patterns and information.
- Iris Dataset: The Iris dataset contains 150 samples of iris flowers with measurements of sepal length, sepal width, petal length, and petal width.
- Data Visualization: Data visualization presents data in graphical form to make patterns, relationships, and distributions easier to understand.
- Scatter Plot: A scatter plot displays the relationship between two selected variables. Each point represents an individual data sample.
- Other Visualization Tools: Histograms, box plots, and parallel coordinate plots can also be used to explore data and identify patterns.
Data Visualization Using the Iris Dataset
WATCH THIS VIDEO TO KNOW MORE
- Step 1 – Launch Orange: Open Orange Data Mining Software to access the blank canvas.
- Step 2 – Add the File Widget: Drag the File widget from the widget panel onto the blank canvas.
- Step 3 – Load the Iris Dataset: Open the File widget, select the Iris dataset, and change the role of the iris column to Target.
- Step 4 – Display the Dataset: Add the Data Table widget and connect the File widget to it to view the dataset in tabular form.
- Step 5 – Explore the Dataset: Open the Data Table widget to examine the 150 iris samples and their sepal and petal measurements.
- Step 6 – Create a Scatter Plot: Add the Scatter Plot widget and connect it to the File widget to visualize the dataset.
- Step 7 – Interpret the Scatter Plot: Examine the relationship between variables, such as sepal length and sepal width, to identify patterns in the dataset.
Classification Using Orange
- Classification: Classification is a machine learning task in which data samples are assigned to predefined categories or classes.
- Training Data: Training data is the dataset used to train a machine learning model to recognize patterns and make predictions.
- Testing Data: Testing data is used to check how well a trained model classifies new or unseen samples.
Steps to Perform Classification
WATCH THIS VIDEO TO KNOW MORE
Step 1: Prepare the Testing Dataset: Create a testing dataset in a spreadsheet using the same feature names as the training dataset.
Step 2: Set Up the Classification Workflow: Launch Orange, add the Tree widget to the canvas, and connect the File widget containing the Iris training dataset to it.
Step 3: Perform Classification: Add the Predictions widget and connect the training dataset’s File widget to it. Add another File widget, upload the Iris testing dataset prepared in the spreadsheet, and connect it to Predictions to classify the testing samples using the trained model.
Step 4: Interpret the Results: Open the Predictions widget to view the predicted class labels for the testing samples and assess the classification model’s accuracy.
Evaluation of a Classification Model
Model evaluation is the process of measuring how effectively a machine learning model makes predictions. Evaluation metrics such as accuracy, precision, recall, and F1 score provide insights into the effectiveness of the classification model.
Steps to Evaluate a Classification Model
Step 1: Perform Evaluation
- Add the File widget to the canvas and connect it to the output of the Classification Tree model to use the dataset from the training phase.
- Connect the File widget to the Test and Score widget to evaluate the model’s performance.
- Double-click Test and Score to view metrics such as accuracy, precision, recall, and F1 score.
- Orange uses 10-fold cross-validation, dividing the data into 10 subsets for training and testing to ensure reliable evaluation.
Step 2: Interpret Evaluation Metrics
- Analyze the evaluation metrics displayed by the “Test and Score” widget. The accuracy metric indicates the percentage of correctly classified instances, which in our case is 93%.
- To gain deeper insights, examine precision, recall, and F1 score. Precision measures the proportion of true positives among all instances classified as positive, while recall measures the proportion of true positives correctly identified. The F1 score is the harmonic mean of precision and recall.
Step 3: Utilize Confusion Matrix
- Add the “Confusion Matrix” widget and connect it to the output of “Test and Score”.
- Double-click it to see the breakdown of true positives, true negatives, false positives and false negatives per class.
- The matrix helps identify True Positives (TP), True Negatives (TN), False Positives (FP), and False Negatives (FN).
- Analyze the matrix to identify classification errors and areas for improvement.
Computer Vision with Orange
- Computer Vision: Computer Vision is an AI domain that enables computers to process and analyze images to obtain useful information.
- Image Analytics Add-on: The Image Analytics add-on provides widgets for working with image datasets in Orange. It must be installed through Options → Add-ons, followed by restarting Orange.
Image Processing in Orange: Converting Images into Numerical Representations for Machine Learning
WATCH THIS VIDEO TO KNOW MORE
Step 1: Install Image Analytics Add-On: Go to Options → Add-ons, install Image Analytics, and restart Orange to make the add-on available in the widget panel.
Step 2: Example Scenario: The goal is to cluster unlabeled images of dogs and cats. Obtain a dataset containing dog and cat images and save it on your computer.
Step 3: Import Images: Drag the Import Images widget onto the canvas and load the folder containing the image dataset.
Step 4: Image Visualization: Add the Image Viewer widget, connect it to Import Images, and double-click it to view the images.
Step 5: Image Embedding: Connect Image Embedding to Import Images to convert raw images into numerical representations. The images are sent to a server, where a deep neural network trained on millions of real-life images computes their embeddings.
Step 6: Computing Similarities: Connect the Distance widget to the output of Image Embedding and select the Cosine option, which typically works well for images.
Step 7: Hierarchical Clustering: Pass the distance matrix to the Hierarchical Clustering widget and double-click it to view the dendrogram, which groups images according to their similarity.
Step 8: Visualization and Interpretation: Use Image Viewer to view each cluster by selecting the corresponding area in the dendrogram. Dogs and cats are grouped separately, demonstrating the effectiveness of image analytics in Orange.
Natural Language Processing (NLP) with Orange
- Natural Language Processing (NLP): NLP is an AI domain that enables computers to process and analyze human language, including written text.
- Text Add-on: The Text add-on provides widgets for text analysis in Orange. It is installed through Options → Add-ons → Text, followed by restarting Orange.
Steps to Analyze Text Using Orange
- Install the Text add-on and restart Orange.
- Add the Corpus widget to load existing text or use Create Corpus to enter your own text.
- Connect the Corpus Viewer widget to browse the text and search for specific words.
- Connect the Corpus or Create Corpus output to the Word Cloud widget to visualize word frequencies.
- Add the Preprocess Text widget and connect it to the corpus.
- Apply text preprocessing, including lowercasing, tokenization, punctuation removal, and stop-word filtering.
- Optionally apply stemming or lemmatization to refine the text further.
- Connect the output of Preprocess Text to the Word Cloud widget.
- Examine the cleaned word cloud to identify frequently occurring words and the main themes of the text